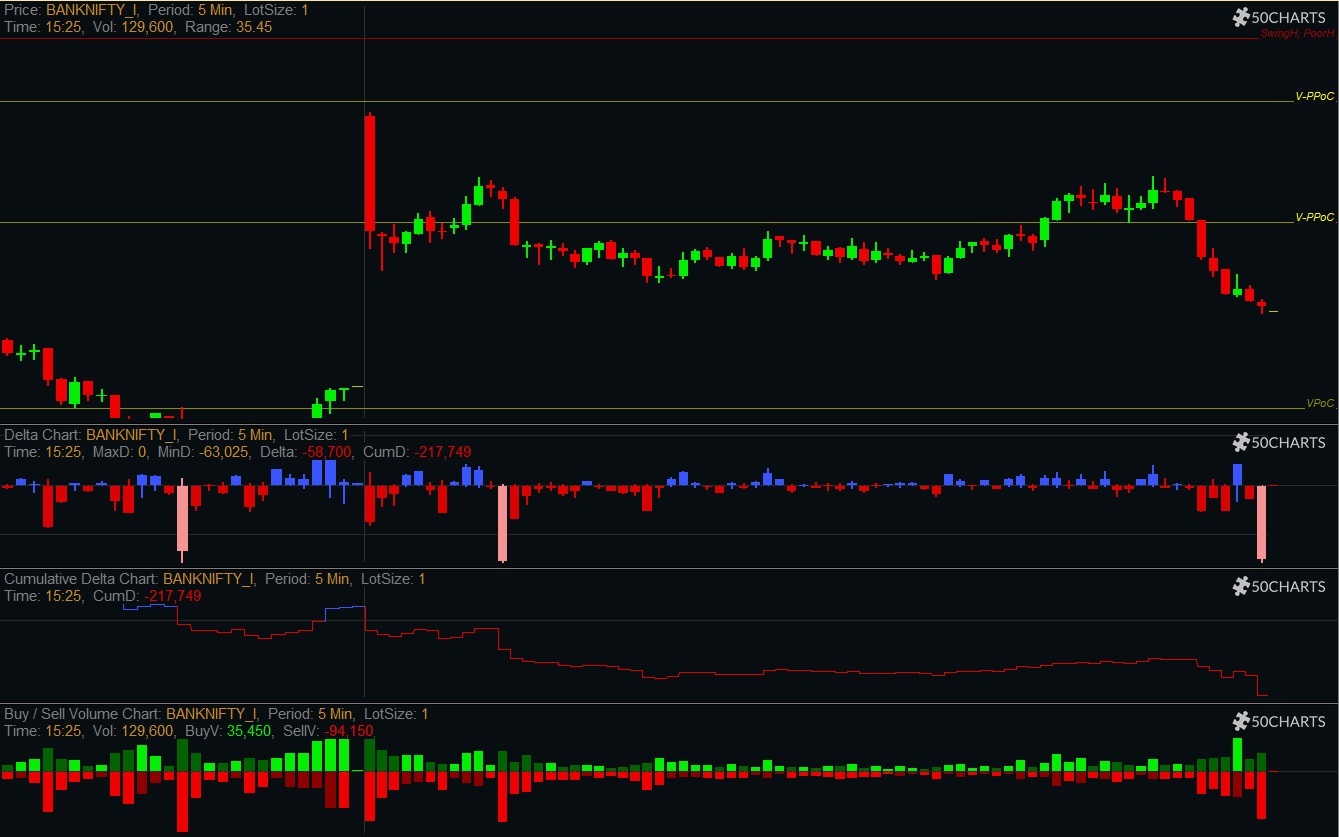
Understand the market

using

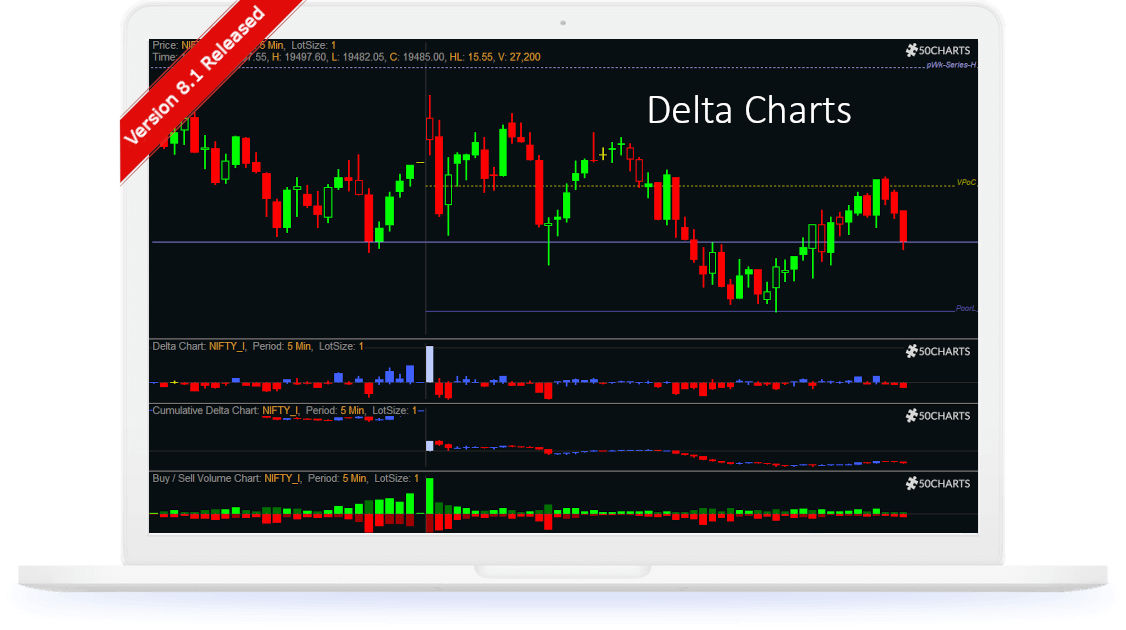
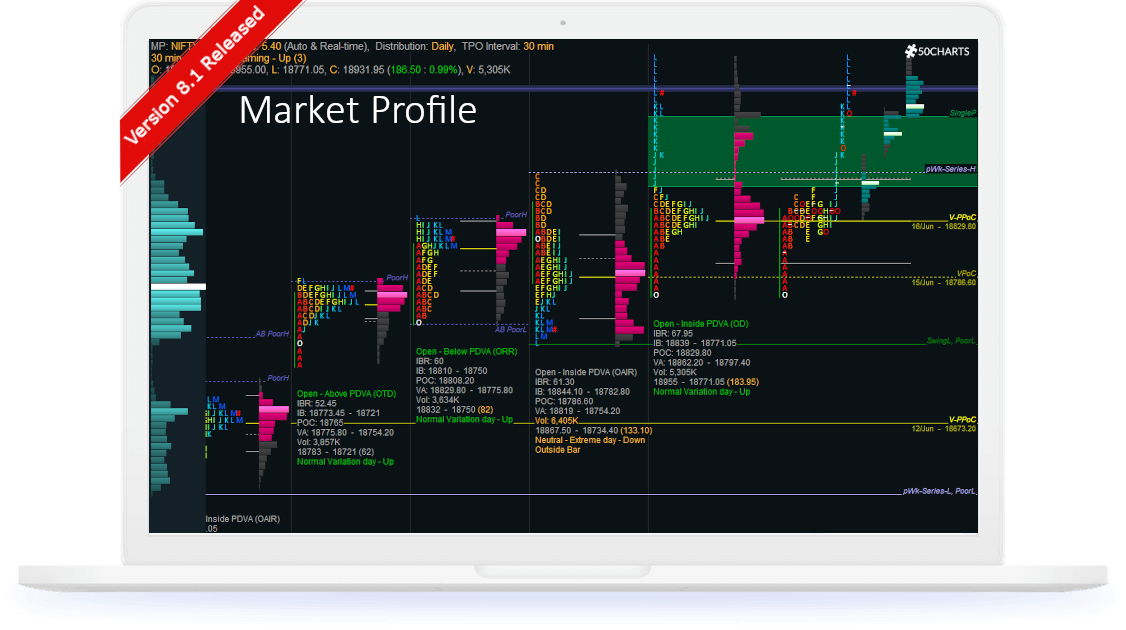
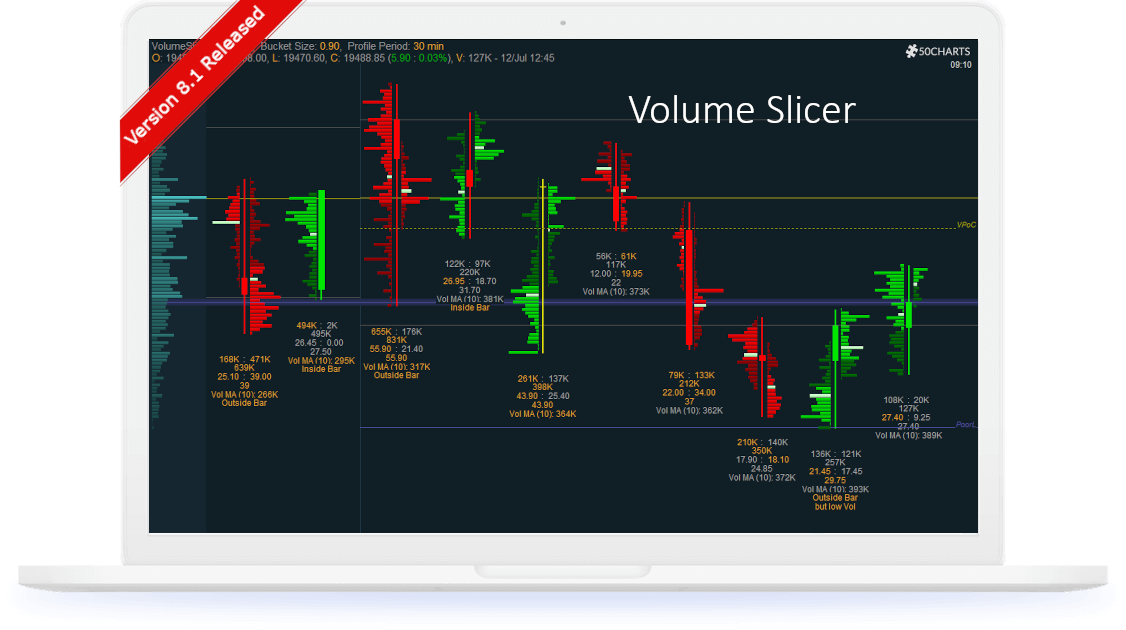
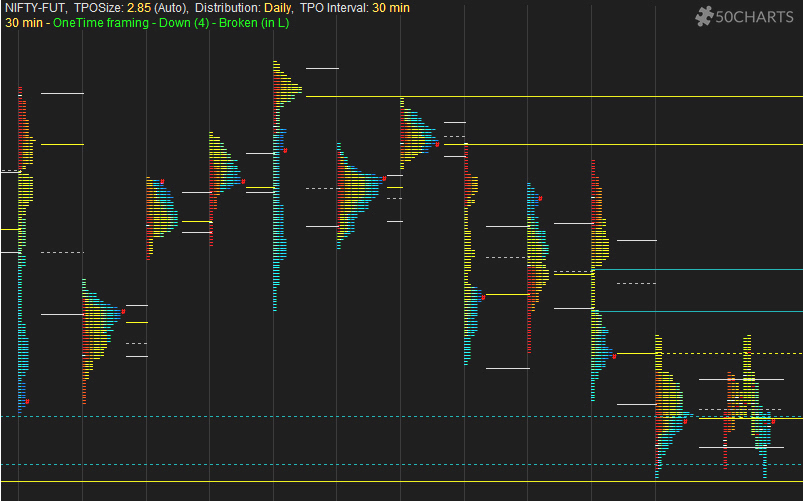
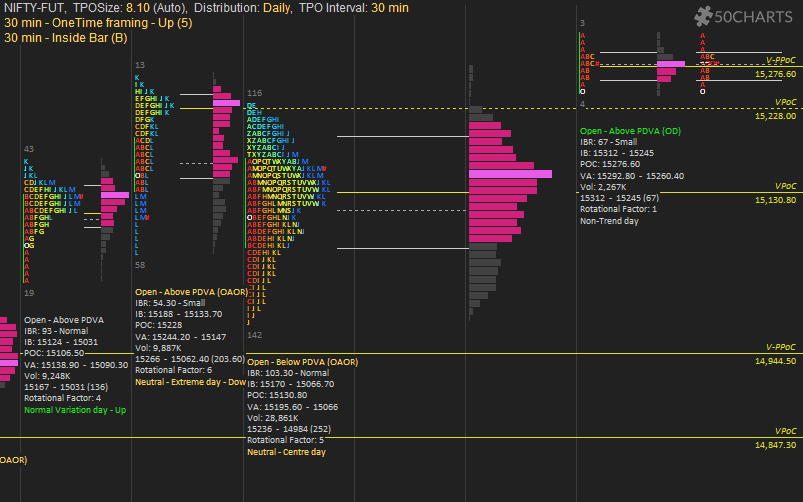
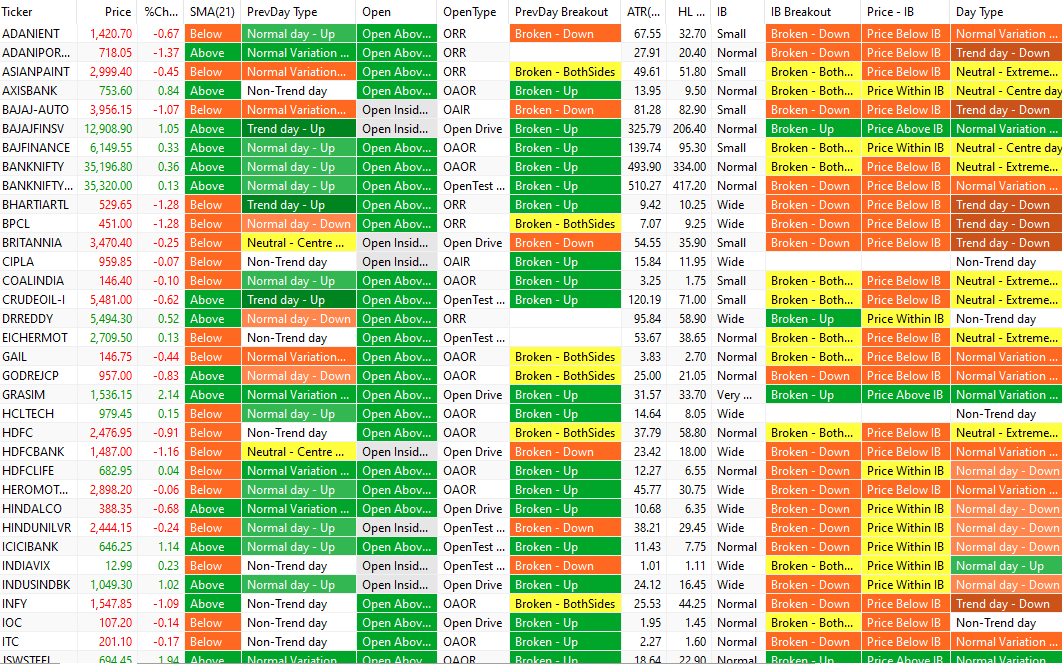
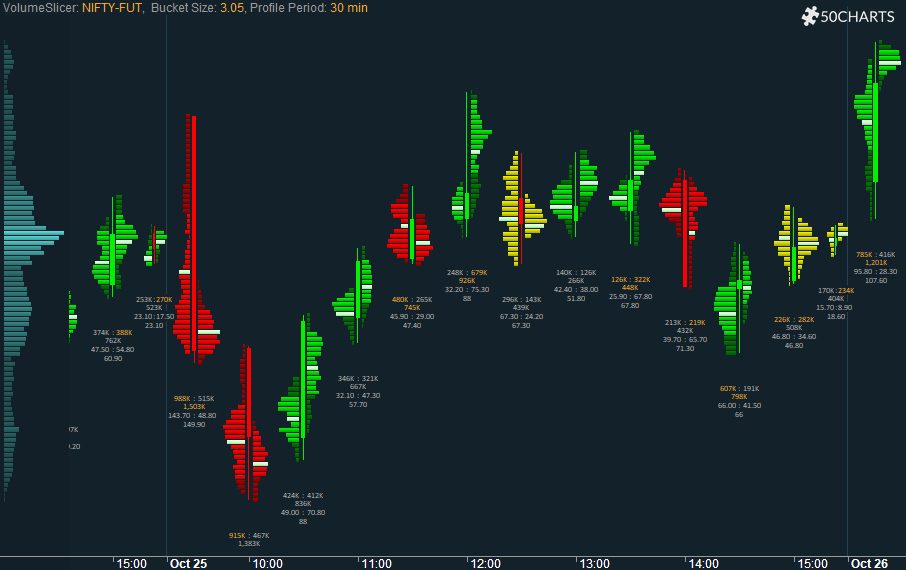
Market Profile, Volume Profile & Delta charts
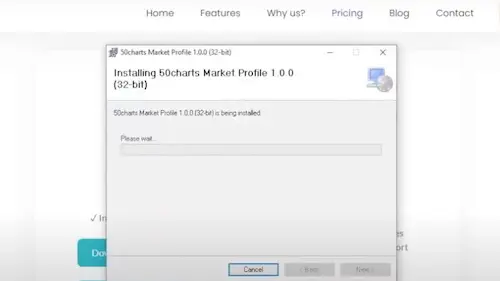
in Amibroker

Empower yourself and shorten your learning curve

Download Now

Free for 3 days

Subscribe Now

Rs. 555 for 30 days

shape

Daily, Weekly, Monthly, Quarterly, Yearly, Monthly & Weekly Expiry Series profiles & Composite profiles

Use Monthly / Quarterly / Yearly profiles to understand the strength of long-term players. Weekly profiles will guide you to identify different Price and Volume zones. Look for entry opportunities in the Daily profile based on the market understanding. Combine any number of profiles to find the strength of buyers / sellers, inside the trading range. The expiry day can be configured to view different Weekly / Monthly expiry series.

Try it Free
Monthly Profile

All-important Price Zones like PoC, VAH, VAL, IB, Halfback, Poor HL, AB Poor HL, Failed Auction, Swing HL, Monthly & Weekly Series HL

Value Area High / Low, Point of Control (PoC) and Initial Balance, acts as a reference to understand the current Market Auction. Half back references are Intraday references to identify weak players. Other reference lines help to monitor the market behaviour at those levels.

Try it Free
Price Zones

Use vPoC, vPPoC, Single Print and High Volume Zones to check the Price rejections

Virgin PoC (vPoC), Virgin Prominent PoC (vPPoC), Single Print, and High Volume Nodes (HVNs) in Volume distribution, helps to identify next possible Support / Resistance.

Try it Free
vPoC and HVN
shape

Alerts to grab the change in Context

One Time framing helps to identify who is in control. Inside bars and outside bars helps to understand whether the market is in Balance or trying to move out of Balance. Any change in Status Quo, will be highlighted to take quicker decisions.

Try it Free
Alerts
shape

Set TPO Size to Auto & Realtime and forget about changing parameters for every stock

The importance of TPO Size, is to approximate the absolute price movements and visualize the Profile. We take care of automatically calulating the TPO Size based on the selected stock price and the available visible space. With just a mouse drag, the TPO Size gets updated in real time.

Try it Free
Auto TPO Size

Detailed Summary with Open Types, Day Types, Volume MA, etc.

Summary provides minute details of the profile like Open Type, Day Type, IB range, Volume MA, etc. Rotational Factor, TPO count helps to understand rotational days. Higher volumes are highlighted to quickly grab attention.

Try it Free
High Performance

Market Profile Scanner to shortlist the stocks quickly

Scanner helps to shortlist the stocks using IB range, Open=High/Low, Prev Day high / low breakouts, Open based on Yesterday's Value Area, Open type after the IB is formed, Day Type, Single Print, etc.

Try it Free
Auto TPO Size
shape

Volume Slicer : The in-depth Volume Profile chart

Volume sliced by Time & Price, in timeframes - 15min, 30min, 60min, 75min, Daily, Weekly & Monthly. It also highlights Value Area, VWAP, color coded profile based on VWAP of first and second half of the candle. Volume Slicer chart works with Tick level accuracy.

Try it Free
High Performance
shape

Delta, Max - Min Delta, Cumulative Delta, Buy - Sell Volume to find the strength of the participants

Delta chart includes Delta, Max Delta, Min Delta, Cummulative Delta, Buy - Sell Volume charts. Tick data is used to calculate these values using Up/Down Tick method. Visual representation of these values provides an additional edge for the traders.

Try it Free
Auto TPO Size

Clean and simple charts, to kickstart your learning process!

shape shape

Subscription

No hefty-upfront Investment. Subscribe every Month until you are confident.

shape shape

Performance

Amibroker is one of the fastest charting tool. Make use of it's power, to try Market Profile charts.

shape shape

Continuous Improvement

We believe in Incremental change. More features will be added Continuously.

shape shape

Free Upgrades

No Extra Charges for Upgrades. Always be up-to-date with the latest features.

Try the Plugin for Free and Subscribe us only when you are satisfied!

*Before downloading, check the System requirements given below


Download (32-bit)

for 32-bit Amibroker

Download (64-bit)

for 64-bit Amibroker


✓ Free for first 3 days - Includes all charts and MP scanner. No Sign Up required. Check How to Install video

BestValue
shape shape
Lifetime access

Rs. 17999

Rs. 14,999

  • ✓ All Charts
  • ✓ MP Scanner
  • ✓ 2 Systems (1 at a time)

shape shape
365 days

Rs. 5999

Rs. 4,999

  • ✓ All Charts
  • ✓ MP Scanner


BestValue
shape shape
90 days

Rs. 1799

Rs. 1,444

  • ✓ All Charts
  • ✓ MP Scanner


shape shape
30 days

Rs. 699

Rs. 555

  • ✓ All Charts
  • ✓ MP Scanner


* Check How to Pay video, to get System ID

shape

System Requirements

  • Before installing 50Charts
    You need to have,
  • 1) Windows (min. Windows 7 SP1)
  • 2) Amibroker (min. version 6.20)
  • 3) 1-minute (or Tick) data provider to Amibroker*
  • 4) Good Internet connection

*You need Tick data to use Delta charts.

New to Amibroker?
Install Amibroker v6.20 (or any higher version) and get in touch with data providers like Truedata, to configure real-time data. Once the data is configured, then we will help you in installing / configuring 50Charts.

Change Log

  • v1.x - Monthly Expiry Series, Halfback, Day Types, Alerts for One Time Framing, Inside Bar
  • v2.x - vPoC, SinglePrint, Alerts for Outside Bar, TPO Count, Rotational Factor, Timer, Composite Profile, Split a profile, AFLs for Candlestick charts, Open Type
  • v3.x - Updates to Volume Profile (with 1-min accuracy) and add Volume Profile for the last 3 TPO intervals
  • v4.x - MP Scanner, Visible Volume Profile
  • v5.x - Volume Slicer, SingleP as Zone, Poor HL, AB Poor HL, Swing HL, Failed Auction, Prev. Week / Month HL, lot of minor improvements
  • v6.x - Delta charts (Delta, Max-Min Delta, Cumulative Delta, Buy - Sell Volume), Volume Slicer at Tick level, MP Quarterly / Yearly profiles, Scan up to 200 Symbols in a Single-Go
  • v7.x - Volume Profile chart (at 1-min & Tick level), Multiple Color themes for MP, MP Monthly using Daily data

Upcoming Releases

  • ○ VolumeFlow
  • ○ OrderFlow
  • ○ Weak High / Low
... and much more

Check out our YouTube Videos
to understand us better!

video

How to install

video

Delta - How to Configure

video

How to Pay (2 mins)

video

How To - Shortcut

video

Market Profile - Scanner

video

Market Profile (in Tamil)

video

Volume Slicer

Books to start with...

Trading books

Self-Help books

Frequently Asked Questions

New to 50Charts / Amibroker

You need to have
  • ✓ Windows (minimum Windows 7 SP1). We recommended Windows 10/11.
  • ✓ Amibroker (minimum version 6.20) - 32bit or 64bit
  • ✓ 1-minute (or Tick) data provider to Amibroker*
  • ✓ Good Internet connection

*You need Tick data to use Delta charts. 1-minute backfill data is sufficient to use Market Profile, Volume Profile and Market Profile Scanner.

New to 50Charts / Amibroker

Amibroker is a paid charting tool. You need to have Amibroker Version 6.20 or higher (like version 6.3x or 6.4x). We do not provide Amibroker.

New to 50Charts / Amibroker

We do not provide data. You need to buy data from any data provider, to get Live market data. We recommend to use Truedata. For Truedata pricing, please check their website.

New to 50Charts / Amibroker

Amibroker is a very powerful charting tool. We use its powerful vector processing AFL functions (Amibroker Formula Language), to create these beautiful charts. 50Charts is a plugin that has to be installed on top of Amibroker. Data provider provides Live data to Amibroker. 50Charts converts the data available in your Amibroker, into respective charts.

Go through the below links to understand these better:
  • How to navigate 50Charts Market Profile chart? Learn more
  • How to work with Amibroker Watchlists? Learn more
  • New to 50Charts / Amibroker

    Step 1: Install Amibroker (version 6.20 or higher).
    Step 2: Get in touch with any tick data provider like Truedata, to configure Live market data. This brings the Live data into Amibroker.
    Step 3: Follow the steps mentioned in this video, to install and configure 50Charts Market Profile, Volume Slicer and Delta charts.

    If you face any difficulties, chat with us from the Chat box available at the bottom right corner of this website.

    New to 50Charts / Amibroker

    50Charts is a plugin that needs to be installed on top of Amibroker charting tool. Amibroker is a Windows only application.

    So you can't use 50Charts in Mobile or in Mac.

    New to 50Charts / Amibroker

    50Charts is a plugin that needs to be installed on top of Amibroker charting tool.

    So you can't use 50Charts in other charting tools like NinjaTrader.

    Pay / Subscribe

    You can pay from this website itself. Check the Pricing section.

    Refer this 2-min video on how to Pay / Subscribe.

    Pay / Subscribe

    50Charts System ID is a unique identifier we use, to identify your System. To get 50Charts SystemID, in your Amibroker go to Window menu, then select Interpretation. Please check the Interpretation window, in the tab in which the Market Profile or Volume Slicer or Delta chart is added.

    Refer this 2-min video on how to get 50Charts System ID.

    Pay / Subscribe

    You can pay / subscribe from this website anytime. When you subscribe now for 30 days, we will add 30 days to your existing subscription end date. Since you have 2 days left, you will now have 32 days in total.

    Refer this video on how to Pay / Subscribe.

    Pay / Subscribe

    50Charts subscription is mapped to your unique 50Charts System ID. If you have re-installed Windows or bought a new System, we need to map your subscription to the new System.

    Send a mail to support@50charts.in with your new computer's 50Charts SystemID. We shall verify your Email-ID / subscription and re-map it to your new computer.

    Refer this video on how to get 50Charts System ID.

    Pay / Subscribe

    You can pay from this website itself. Refer this video on how to Pay / Subscribe.

    Pay / Subscribe

    Lifetime subscribers can use 50Charts in 2 systems but can use it in only 1 system at a time. Once Amibroker is opened in the second system, 50Charts session in the first system will be logged out.

    This is a useful feature, if you have 2 systems (like Home / Work systems). With one lifetime subscription, you can use it in 2 Systems.

    Send a mail to support@50charts.in with your 2nd System's 50Charts SystemID. We shall verify the subscription and map it as your 2nd System.

    Pay / Subscribe

    Right now, we don't have any referral programs.

    Learning

    Currently, I don't conduct any trainings.

    And, I don't recommend any trainers. Looks like, lot of trainers are fake traders.

    Learning

    Market Profile is a very fascinating study of Market Context. Follow the below steps to learn Market Profile.

    Step 1: Introduction to Market Profile - Why do we need Market Profile? You can ignore this, if you dont understand Tamil.

    Step 2: Basics of Market Profile - This is a 10-part video series with a total running time of around 10 hours. This is a good place to learn the basics of Market Profile.

    Step 3: Books - I have listed some book names in this website. Start with "Mind Over Markets" book, by James Dalton.

    The 10-part series explains just the first chapter of the Mind Over Market and CBOT book (CBOT book is the second book listed in the above link). Each of these books contains several chapters. So read these books without fail.

    Step 4: Some more Books - Read all the other books, listed in the website.

    Step 5: Complete Step 1 to 4 and then ask me, I will explain you.

    Charts

    By default, the TPO size calculation is set to "Auto & Real-time". So, when you zoom in/out, the TPO size of the chart changes (TPO size is displayed at the top left corner of the chart). Hence the VAH / VAL / PoC / Single Print values change. This is the expected behaviour.

    If you don't want this to happen, set the TPO size calculation parameter to "Manual" and set your desired TPO size. But I recommend to use the Auto TPO size only.

    When the TPO size calculation is set to "Auto & Real-time", you can change the TPO size by pressing Shift key and dragging the Y axis.

    If you can understand Tamil, please watch this video, to understand my views on TPO size.

    Charts

    Usually, we recommend to consider these references as zones, instead of exact levels. That's why we have hidden the Single print values, by default.

    You can view these values,
    1) By changing "RefLines - SinglePrints - Values" parameter to "Display" (or)
    2) By using CrossHair. You can enable it, in View menu -> CrossHair.

    Charts

    50Charts uses the data available in your Amibroker, to compute its charts. If you are able to view the Market profile chart but the latest data is not reflected in it, then it means, you may not be getting the Live market data from your data provider.

    Try backfilling data from your data provider. In case if you are using Truedata, right click on the Ok button at the bottom right of the Amibroker and select "Backfill all charts / all data".

    If the Live data is still not reflected in your Market Profile chart, get in touch with your data provider.

    Charts

    You can assign the Symbols into different groups and then assign different Start / End Timings to these groups. So, there will be a NSE group, a Commodity group, a Forex group, etc. Each group will be assigned with its relevant symbols. Then assign different timings to each group.

    Check this Amibroker forum thread for more details.

    Scanner

    The Market Profile Scanner outputs the following columns:
    •  1) Previous Day (PD) values - PD-High, PD-Low, PD-Close
    •  2) Current Day values - Open, High, Low, Open=H/L, Price, %Change
    •  3) Market Profile - Previous Day values - TPOSize, PD-VAH, PD-PoC, PD-VAL, PD-DayType, PD-SinglePrint
    •  4) Market Profile - Current Day Open values - Open with respect to PD-VA, Open with respect to PD-HL, Open Type, PD-Breakout
    •  5) Market Profile - Current Day IB values - ATR(10), HL Range, IB-High, IB-Low, IB Range, IB Size, IB Breakout, Price with respect to IB
    •  6) Market Profile - Current Day values - VAH, PoC, VAL, Today's VA with respect to PD-VA, 30min PreviousBar, Day Type, Single Print

    Scanner

    1) If the Scanner displays an error, there is a possibility that either:
    • (a) You might be scanning lot of stocks.
      Solution: Create separate watchlists and scan not more than 200 stocks at a time. Check this Amibroker documentation, to learn more about Watchlists
      (and / or)
    • (b) You may not be having the latest data.
      Solution: To get the latest data, backfill data from your data provider.

    2) If the Scanner output is incomplete or incorrect, there is a possibility that the latest data is not available in your Amibroker.
    Solution: To get the latest data, backfill data from your data provider.

    Steps to backfill data:
    In case if you are using Truedata, right click on the Ok button at the bottom right of the Amibroker and select "Backfill all charts / all data".

    Scanner

    We have not added any feature to view Delta / Cumulative Delta in the Scanner / Explorer. We shall revisit this later.

    Error - Charts

    It looks like you have added the Market Profile plugin multiple times to the same chart (same tab). Right click on the error displayed area and delete the excess indicator(s) by selecting them in "Delete Indicator".

    If you still face this issue, chat with us from the Chat box available at the bottom right corner of this website.

    Error - Charts

    You may not be having data for the selected Symbol. To get the latest data, backfill data from your data provider. In case if you are using Truedata, right click on the Ok button at the bottom right of the Amibroker and select "Backfill all charts / all data".

    If you still face this issue, chat with us from the Chat box available at the bottom right corner of this website.

    Error - Charts

    (1) For Market Profile chart, the interval of the chart has to be 1-minute only. This is required as we calculate Volume Profile at 1-minute level.
    Exception: For Quarterly and Yearly profiles, the interval of the chart has to be "Daily".

    (2) For Delta charts, the interval of the chart has to be 1 Tick only.

    Error - Charts

    Timeout error might be due to some intermittent internet connectivity issue.

    Click on the 50Charts logo at the top right corner of the chart area. This will refresh the chart.

    Error - Charts

    You might have zoomed-in a lot into the chart. Try zooming-out the chart.

    If you still face the issue, chat with us from the Chat box available at the bottom right corner of this website.

    Error - Charts

    You might be using a very old version of 50Charts. Follow the steps mentioned in this video, to install and configure the latest version of 50Charts.

    If you face any difficulties, chat with us from the Chat box available at the bottom right corner of this website.

    Error - Charts

    Usually, we refresh server keys at 12am. Reopening Amibroker will solve this issue.

    If you still face this issue, your time zone needs to be updated in 50Charts server. Contact us from the Chat box available at the bottom right corner of this website.

    Update - New Version

    Follow the steps mentioned in this video, to install and configure the latest version of 50Charts.

    If you face any difficulties, chat with us from the Chat box available at the bottom right corner of this website.

    Update - New Version

    Follow the steps mentioned in this video, to install and configure 50Charts Market Profile, Volume Slicer and Delta charts.

    If you face any difficulties, chat with us from the Chat box available at the bottom right corner of this website.

    Update - New Version

    It depends on whether your Amibroker is 32-bit or 64-bit. To find this, in your Amibroker, go to Help menu and select "About Amibroker". If your Amibroker is 32-bit, install 32-bit 50Charts. If your Amibroker is 64-bit, install 64-bit 50Charts.

    Download 50Charts plugin from here.

    Update - New Version

    There are No extra charges to install new version of 50Charts. We believe in "Continuous Improvement". So, the charts will be improved periodically.

    Upcoming release(s)

    Currently, we are working on Minor Updates to Volume Profile charts. Orderflow development will be started after the next release.

    Contact - Support

    We will be online in the Chat box, present at the bottom right corner of this website, from 9am to 3pm (Monday to Friday, except on Trading holidays).

    You can also contact us through,

    Contact - Support

    Usually, we will be online in the Chat, from 9am to 3pm (Monday to Friday, except on Trading holidays). In case, if we didn't respond to your messages, sorry for the inconvenience.

    We will get in touch with you as soon as possible, through WhatsApp or Email.